.png)

Bayesian Thinking and Product Risks
When we start to acknowledge uncertainty, our language evolves. Instead of saying, “I will do this, which will produce this result” we frame ideas more in the syntax of a hypothesis:
“I believe that if I do this, then this result will happen.”
This opens the door for more nuanced statements that include our confidence in the belief, a confidence which can (and should) change over time.
In the statement above, there are multiple clauses where we can bring a more probabilistic way of thinking:
- How confident are you that the thing will happen? (i.e. that you will observe it)
- How confident are you that the result will happen? (i.e. that you will observe it)
When we capture our confidence in our beliefs in probabilistic terms, it helps communication within our team. We can start to have a dialog on the “missing information” that we wish we had (or capabilities we wish were stronger), to reduce the uncertainty, and drive our confidence up. The dialog will often expose new information (since we’re drawing from the whole group) and counter individual biases that might slant the confidence levels (if done alone).
Most importantly, when we capture our initial confidence as probabilities, we can more effectively apply new information, or new evidence, to adjust our probabilities over time. As we learn, those probabilities can (and should) change.
Sometimes we observe things that drive our confidence up. Sometimes we observe things that drive our confidence down. This is the whole point of feedback loops, right?
Bayesian thinking brings a more structured, disciplined approach to this idea of updating our hypotheses when new evidence emerges. These initial probabilities are explicitly captured, to get a baseline of what we think we know.
Also, we model the relationships between a variable event like the “thing done” above, and the “result” we want to observe. Specifically, we refine our confidence model, up front, with these probabilities:
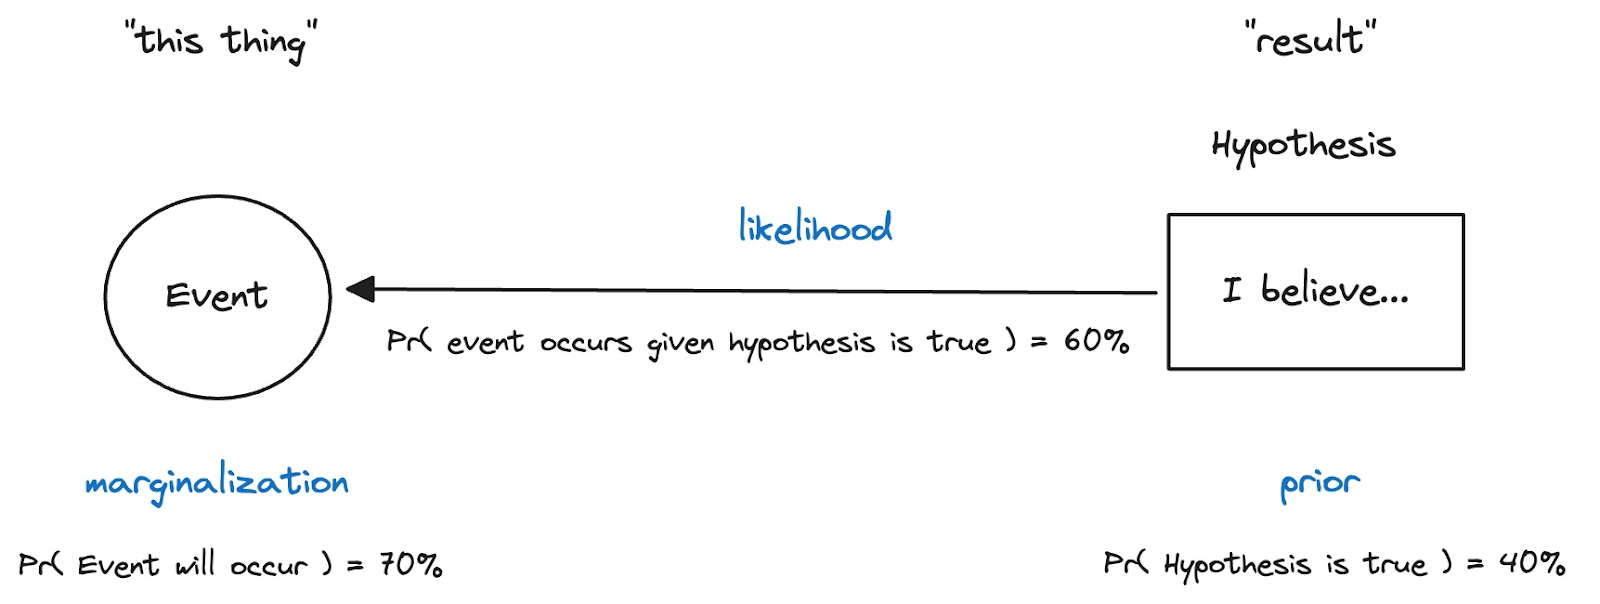
- What’s our confidence (right now) that this thing will occur?
- Probability that this event will occur = 70% (thinking...mostly under our control)
- What’s our confidence (right now) that the result will occur? (i.e. our hypothesis)
- Hypothesis: I believe that if I do this thing, this result will happen
- Probability that this hypothesis is true = 40% (thinking...lots outside our control)
- What’s the likelihood that we did this thing, if the result actually happens?
- This is a hypothetical, backward-looking probability that assesses the strength of the relationship between the event and the result.
- Probability that the event will occur, given that our hypothesis turned out to be true = 60% (thinking…we likely influenced that result, but luck might have had something to do with it too)
Why go to all this trouble? Well, there’s some math that we can use to bring some more discipline to how we connect observation (i.e. of new evidence or information) to our revised views of our confidence in success.
And that’s important, right?
While there are tools that package this math in algorithms, my intent here is to just present it as a thinking model. The point is that observations and events should trigger adjustments to your confidence in your beliefs. The numbers just help drive the point home.
Bayes’ Theorem takes those probabilities we captured and surfaces them (as our “prior” view of the world) when we observe something new - something that we had placed a probability against earlier.
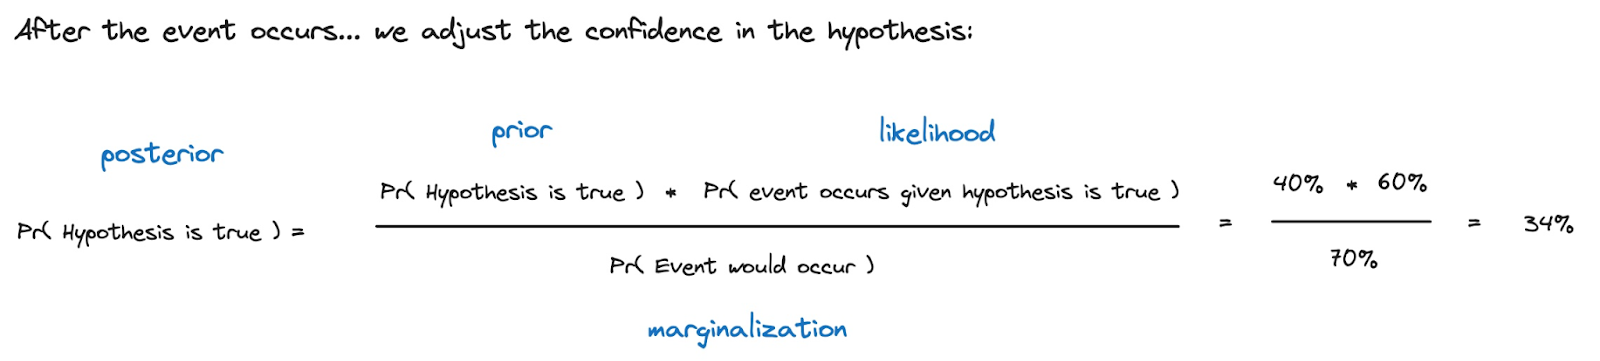
In this example, we had previously said that we had 40% confidence that the result will happen. We also said that if the result DID happen, it was 60% likely that the event occurred. And we also previously captured that we thought the probability of the event occurring was 70%.
When the event actually occurs, we have a new observation - some new information - that justifies a revisit of our confidence in our hypothesis. Bayes theorem essentially says,
“Well, this event occurred, sure, but you were already pretty sure it would (70%), and you weren’t even that sure that, hypothetically, the event would have occurred if (at some point in the future) the result happened (60%), so I took that to mean the ties were weak. So given all that, I think you should have even less confidence in the result now (34%) than you did before (40%).”
It’s a little counter-intuitive, but hey… that’s statistics, right?
Consider a different version of that story, where our initial probability on the event occurring was only 50%:
“Hey, this event, that you said was 50/50 (50%), actually happened, despite the odds. So given that you thought it was 60% likely that you’d see this event, if the result happened, I think you should feel a lot more confident now (75%) than you had been (40%).”
In this second case, since you previously felt the event occurrence had longer odds, then, when it occurs, it has more significance for your adjustment. [I’m not sure the numbers in the math in the example pass the “smell test”, but it’s the mechanism we’re after here.]
So how could we apply these ideas from Bayesian thinking into our strategic decision making? I think there are a few key lessons:
- It is important to quantify the uncertainty in our beliefs (e.g. big strategic hypotheses) in probabilistic terms, to support later adjustments, when new information and evidence comes in.
- It is important to put a probability on events that we deem to be related (can you tell I’m being really careful not to use the word “causal” here?) to the outcomes in our hypotheses.
- We can show relationships between variables in graphical representations, and eventually even refine them into causal diagrams, if warranted (again to support communication and a shared understanding of beliefs around causality, and to bring in other models).
Let’s build an illustration in a specific domain. Here’s a rough sketch for product managers, that highlights some variables involved in key hypotheses, and how they might be related. It’s derived from Marty Cagan’s “Four Big Risks”.
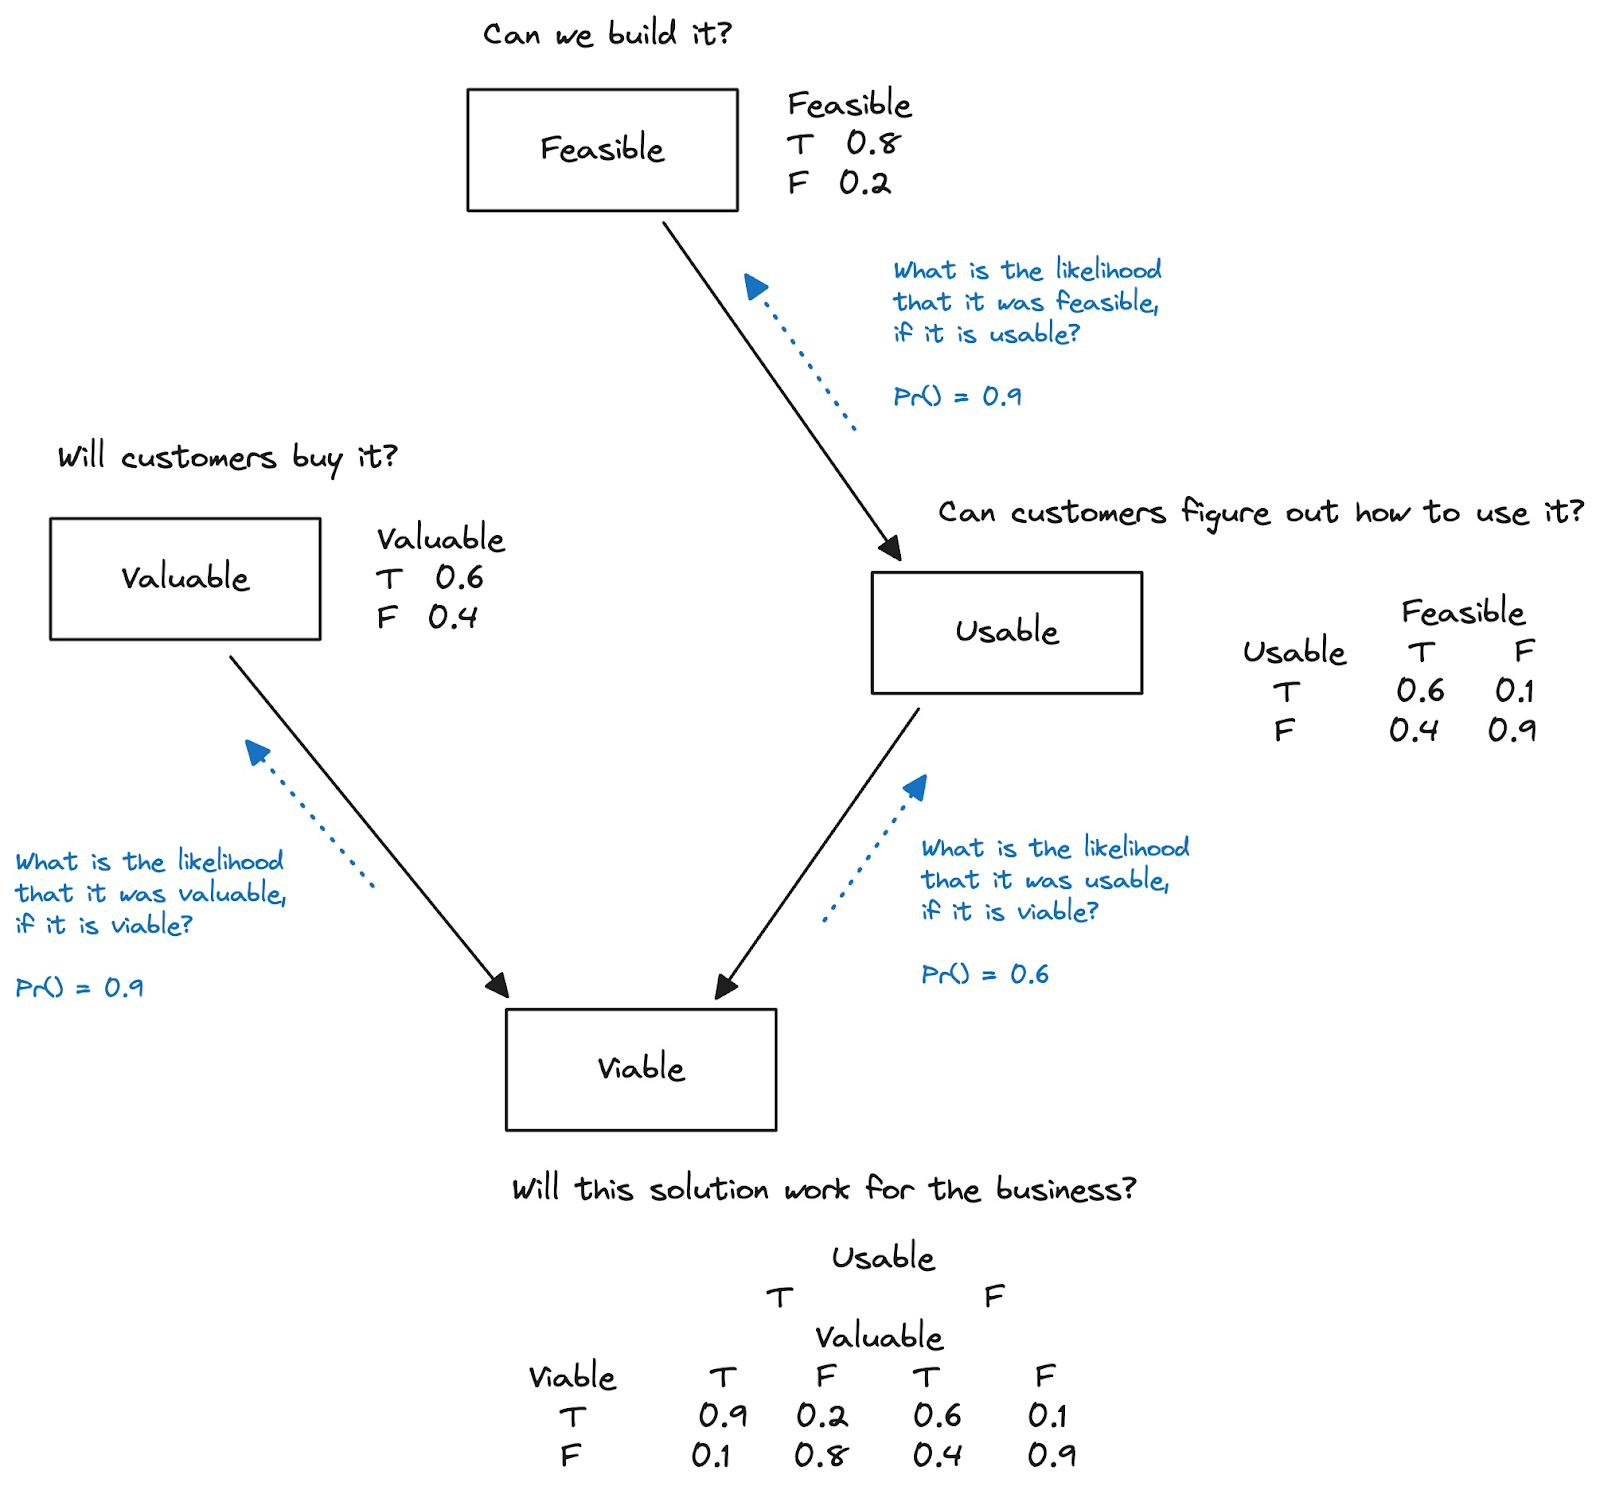
When we devise a product strategy, we develop hypotheses that connect these four variables. But do we make the relationships visible? Do we make our confidence visible in probabilistic terms? Not that often.
Here’s how to read the probabilities above. [Note that they would be provided by your “experts”, up front, perhaps as part of a risk exercise.]
- Engineering experts said that they are 80% confident they can build it.
- Design experts said that they are 60% confident that users will be able to use it, given that we are able to build it.
- Marketing experts said that they are 60% confident that the offer is unique and valuable to customers.
- Business experts said that they are 90% confident that they can meet business goals with it, given that customers will buy it, and users keep using it.
These probabilities in the diagram capture our context-specific impressions of our chances at success. And this example is structured, more or less, by what we (unfortunately) have as silos today: engineering tackling feasibility, design tackling usability, marketing tackling value, and the business leaders looking at viability.
A constant refrain is that these efforts are not synched and coordinated enough. Could this thinking model help? At least to drive dialogs around risk, and how risks are changing over time?
Conceptually, it seems to hold up. We are constantly monitoring the new information coming out of engineering efforts, discovery efforts, marketing explorations around new pricing models, product usage metrics, and (of course) sales figures. Today, all this new information drives our intuition around these variables, and the associated risks we are accountable for monitoring.
For better monitoring of what drives those risks (the ones we care the most about), we could “double-click” into any of these four variables shown above, and build out a model one layer down, with new variables and new relationships that influence the ones up top.
For example, we could:
- Think about variables for a project milestone or working software at a product demo, as an event that drives an adjustment in the probability of feasibility.
- Think about variables from A/B testing or bug trends, as events that drive adjustments in usability probability.
- Think about variables from market research and pricing experiments, as events that drive adjustments to the probability of having a unique value proposition.
- Think about variables in external market conditions and competitor actions that produce events that should drive adjustments to the probability of business results.
It seems that this is what we already do, intuitively.
While it won’t resolve into simple formulas, Bayesian thinking can help us evolve our thinking models to do a better job of closing our learning loops when presented with new evidence and insights.
It all starts with a deliberate attempt to capture your current beliefs, along with your current confidence levels, to set up that “prior” that you will reflect upon later. And that’s relatively easy, right? Maybe just try that, with your leadership team, and skip the math for now :)


.png)